

|
|
|
You are herePredators and Prey: the Lotka–Volterra modelThe first model describing the interaction between two populations in the ecosystem is the Lotka–Volterra model. It applies to a predator-prey system (population of predators feeds on the individuals of the prey species). The model was proposed in 1920s in parallel by Vito Volterra as a model of a population, and by Alfred Lotka as a model of a chain of chemical reactions. Volterra proposed this model to explain the phenomenon that was observed after the First World War. It was noted that the population of predatory fish in the Adriatic Sea had increased. This was considered a paradox, because it would seem that all species should be negatively affected by the war. Volterra based on his model showed that the increase in the number of predators was natural because fishing was stopped during the war, and thus the population of predators could return to its natural state. The model takes the following assumptions:
Lotka–Volterra simulationSelect language of the program: Program descriptionThe above multi-agent simulation is inspired by the Lotka–Volterra model. The simulation is not a perfect equivalent of the model: the model has a continuous nature, and besides, the simulation takes into account the position of specimen in the environment. In the considered model, two species interact with each other: prey (rabbits) and predators (foxes). Individuals move in a random way and are visualized by a green and a red color. Default parameters allow to observe oscillation of population cardinality for rabbits and foxes. This can be explained in simple terms: increasing the number of rabbits results in the short time increase in the number of foxes. The population size grows due to the availability of food. But after some time, there is not enough food for the entire population of foxes and they start dying. In turn, this will affect the regeneration of rabbits and the cycle starts over. The size and variability over time (i.e., population dynamics) can be seen on the charts. The first one shows the so-called phase portrait of the system of equations. The axes of the coordinate system correspond to the cardinality of the population of both species and points illustrate inter-related population sizes for several recent steps of the simulation. The second chart shows the dependence of the number of individuals of each species, depending on time (which is associated with the solution of equations system of the L-V model – see below). Axes describing sizes of populations have relative units, e.g. 50% means that a half of the environment is occupied by a given population. Tips for using the program: Simulation parameters
The parameters that are equivalent to the L-V system of equations are interpreted as the probability of occurrence of relevant events in subsequent iterations of the simulation. You can experiment with the parameters during the simulation to observe how they influence the size of populations of rabbits and foxes. Try to set parameters that lead to the extinction of one of the populations. Running the simulationThe Start button starts the simulation. Simulation speed can be controlled by the appropriate slider. During simulation, it is possible to change some parameters and their impact on the ecosystem can be observed live in the environment and the charts. The Reset button causes random initialization of the environment, according to the World size, Initial % Rabbits and Initial % Foxes. TheoryLet us denote by The system of equations together with the assumptions given above is called the Lotka–Volterra model (L-V) or the predator–prey model. For simplicity, the independent variable t is omitted. The equations are 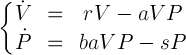
where
It turns out that for non-negative initial data, there exist solutions that are unambiguous and non-negative – therefore they have a biological meaning. The solution of this system of equations consists of two periodic functions shifted in phase.
|