
|
|
|
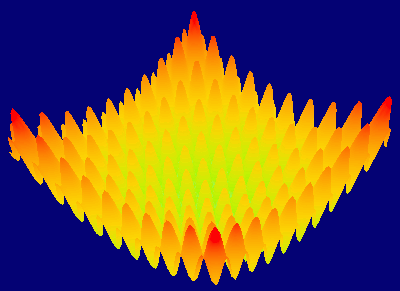
You are hereDiscovering peaksEvolution is a complex process. Let's simplify it and consider a single, constant criterion (feature, trait) for fitness. Then we can plot the criterion values against the fitness values and obtain a two-dimensional diagram. If we have two traits, then three dimensions are required. 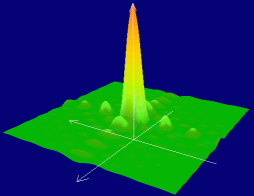
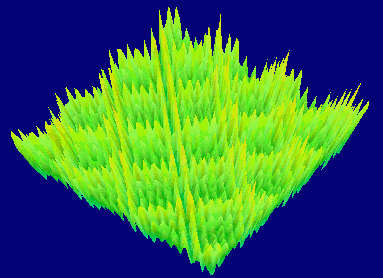
Discovering peaksThe problem is to find the values of traits that give the best fitness. But how to find them if we cannot afford testing all combinations of trait values? We have to use optimization algorithms. However, the fitness landscape does not have to be as simple as shown above. See the samples below. Note that we still consider a simplification of the biological evolution.
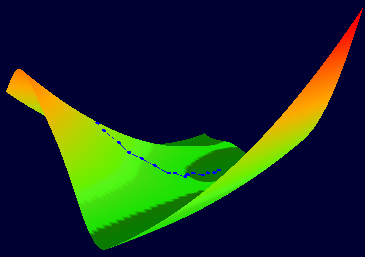
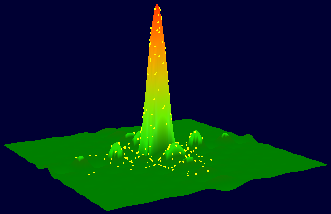
The OptiVis program demonstrates local and global optimization (algorithms: Greedy, Steepest, Simulated annealing, evolutionary/genetic algorithm). It allows you to define a function of up to 20 variables, with two- or three-dimensional visualization. Below on the left you can see the search path of the Steepest algorithm looking for the minimum. On the right, evolutionary search for maximum is shown (with yellow points as individuals).
The user interface has five tabs. Sample functions can be loaded from the supplied files. Blue balls represent (best known) solutions. Instead of downloading the application, you can run a slightly simpler version directly in your web browser. Just select your language by clicking the button:
We have made the OptiVis program available that will let you learn about the methods of optimization. The software (for MS Windows) is compressed as a ZIP archive. This program was used to plot images shown on this page. There is the OptiVis source code available for programmers (GNU GPL license, for Borland C++ Builder 6.0).
|